Head Office
|
Aleja Tysiąclecia 11 82-300 Elbląg |
|
phone: +48 (55) 237 60 00 fax: +48 (55) 237 60 01 |
|
E-mail address: |
Office in Warsaw
|
ul. Grzybowska 80/82 lok. 700 00-844 Warszawa |
Remote sensing enables the acquisition of vast amounts of data about the urban environment. Through comprehensive analysis, it is possible to extract crucial information from this data for better management of green spaces in the city. Utilizing technology, we strive to deliver products focused on the needs of the recipient, ensuring practical applications.
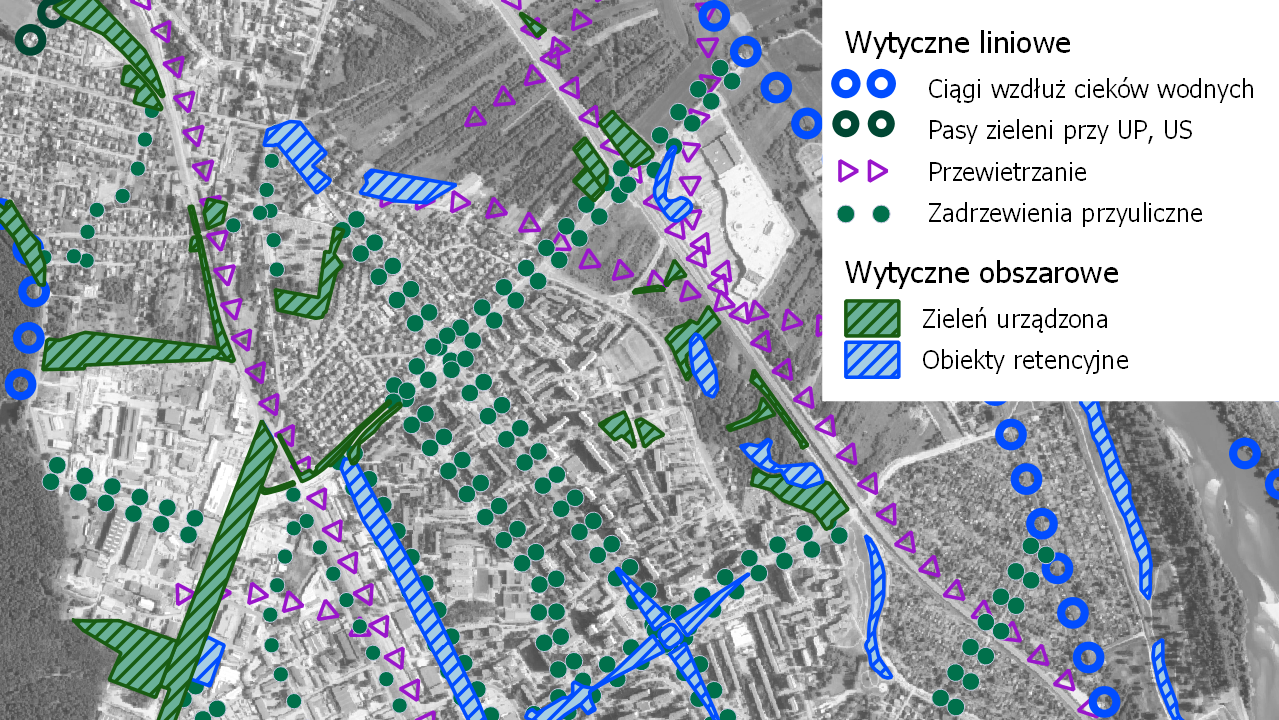

Blue-green infrastructure system design tailored to your city. An expert study based on conclusions flowing from a whole series of remote sensing analyses to map the current state and existing problems. As part of the project, we provide maps and a report containing detailed analyses, recommendations for shaping the system and planning guidelines.
Having a green infrastructure project based on data, analysis, and expert knowledge provides a complete diagnosis of the state of Green Infrastructure and a list of actions to improve the quality of residents life in terms of:
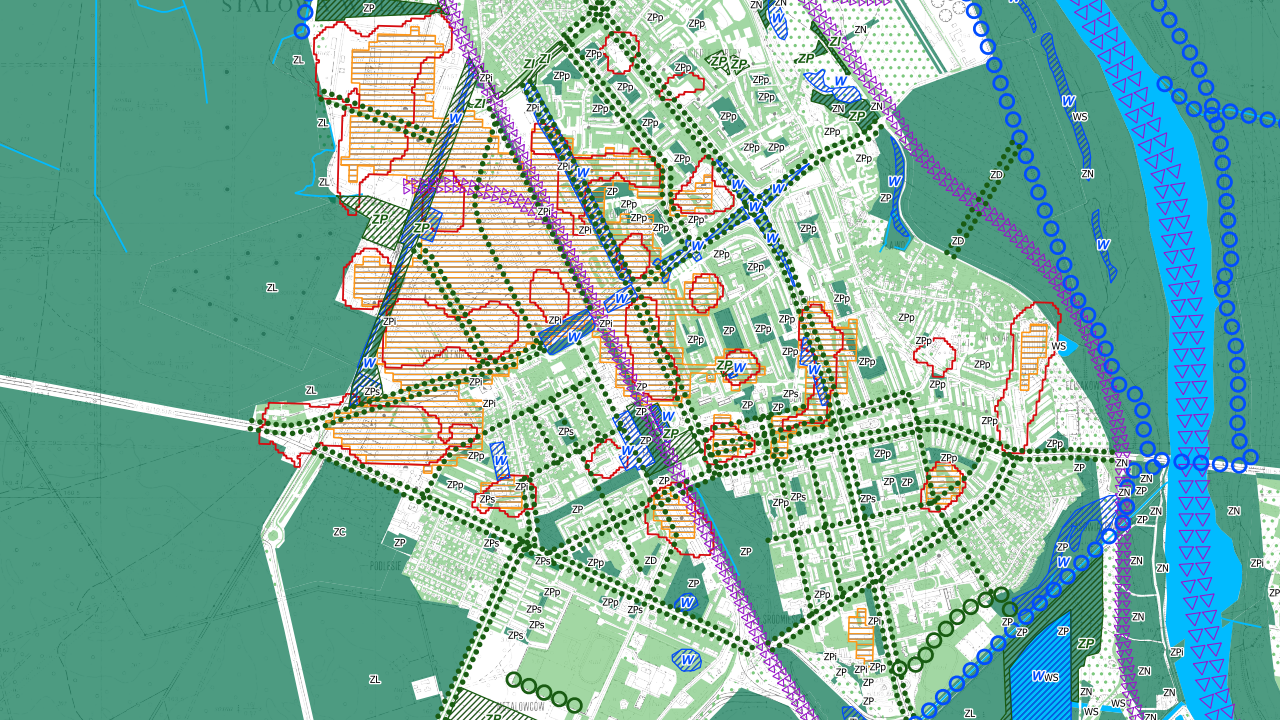

We are developing Urban adaptation plans (UAP) in accordance with the newest Ministry of Climate and Environment guidelines, based on EU Adaptation Strategy. Our UAP includes a concept for greening the city and a concept for rainwater management. In addition, we include conclusions and planning guidelines in the report, which are based on the results of remote sensing analyses that provide detailed information on the exact location of problematic phenomena and their scale.
A well-constructed UAP makes it possible to accurately diagnose climate risks for the city and provides appropriately tailored proposals for adaptation measures. The product will allow to meet the requirement of having an UAP for cities with more than 20,000 inhabitants. The UAP is often the basis when applying for European funding for city adaptation investments.
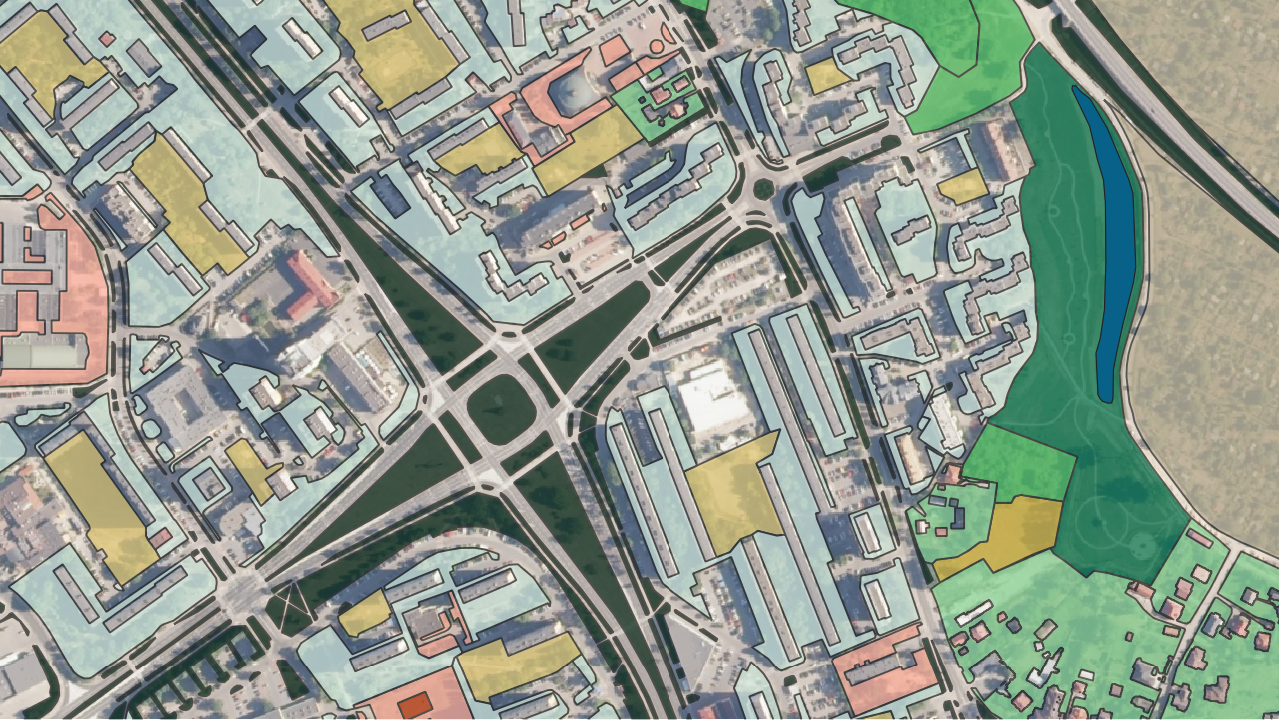
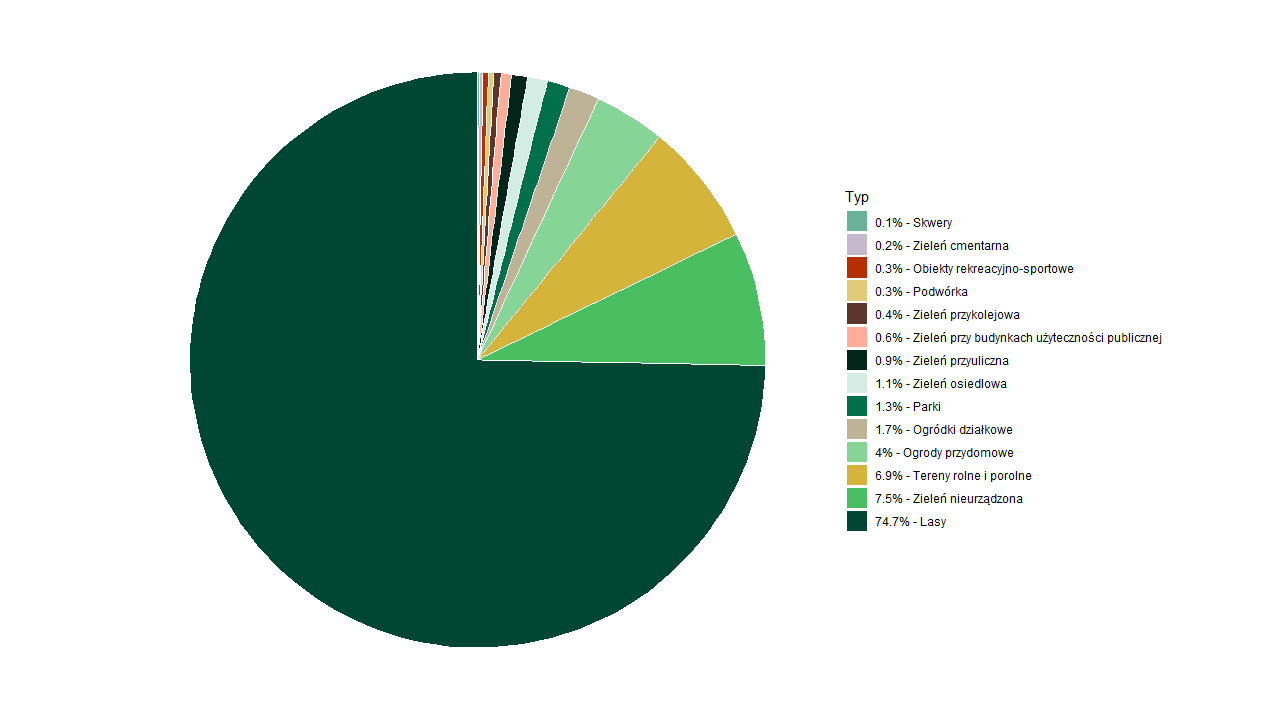

Remote sensing inventory of all green areas based on the interpretation of orthophotos, lidar and existing databases. We categorize land due to the adopted typology and analyze the ownership status.
We separate up to 14 classes of green urban spaces.
The primary source of information on the types of greenery in the city, their quantity and structure.
A comprehensive spatial database is the most essential foundation for spatial planning.
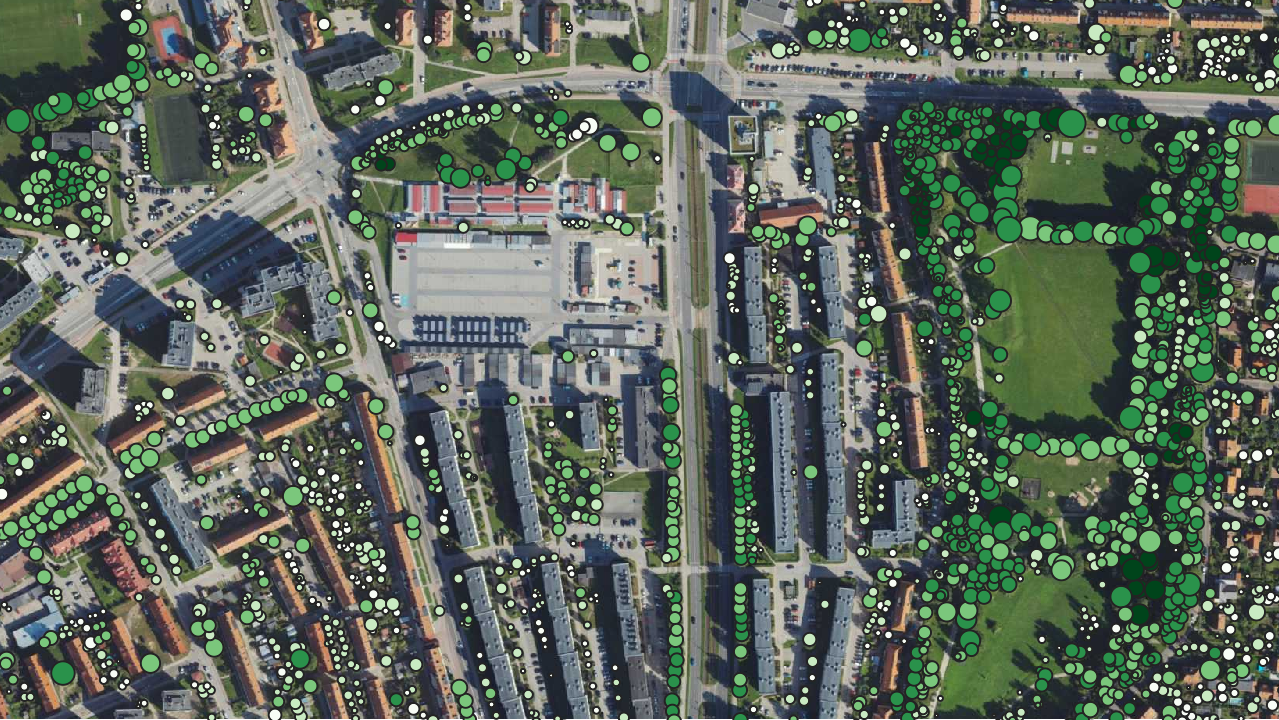
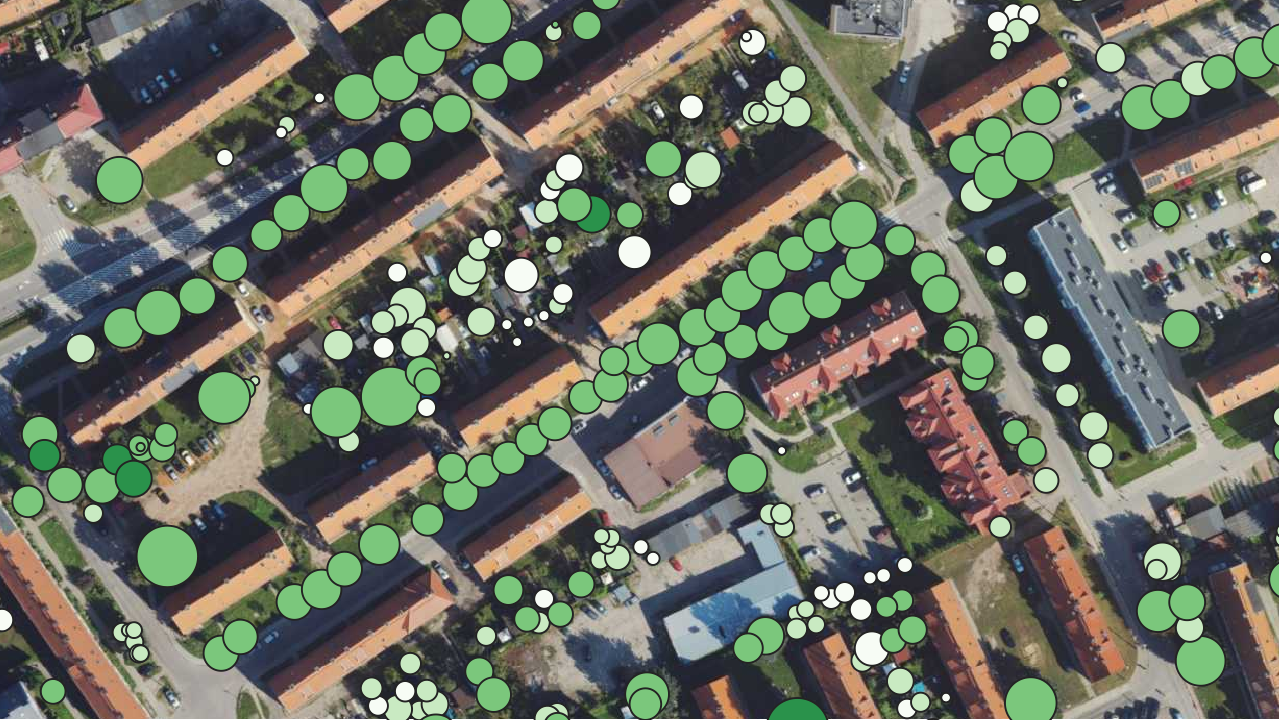

A tree crown map is created through a segmentation process, which involves extracting individual tree crowns from a lidar point cloud. Tree crowns are represented by circles which size and colour symbolize the area of the crown projection and the height of the treetop or the volume of the crown.
Accurate inventory of trees in the city.
The database for individual trees allows for better management of tall greenery.
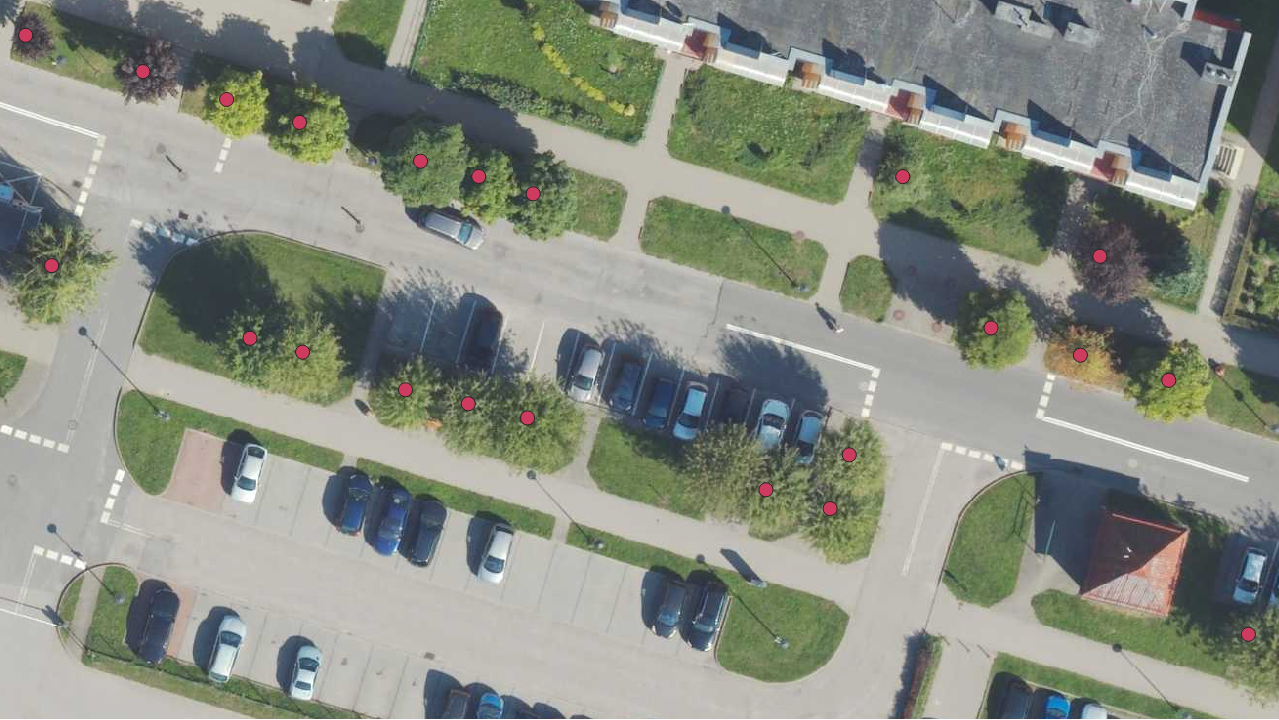

The tree trunk map shows the point location of tree trunks. We integrate the trunks with the tree crown map and make the result consistent so that the two databases match.
Accurate inventory of trees in the city. The database for individual trees allows for better management of tall greenery.
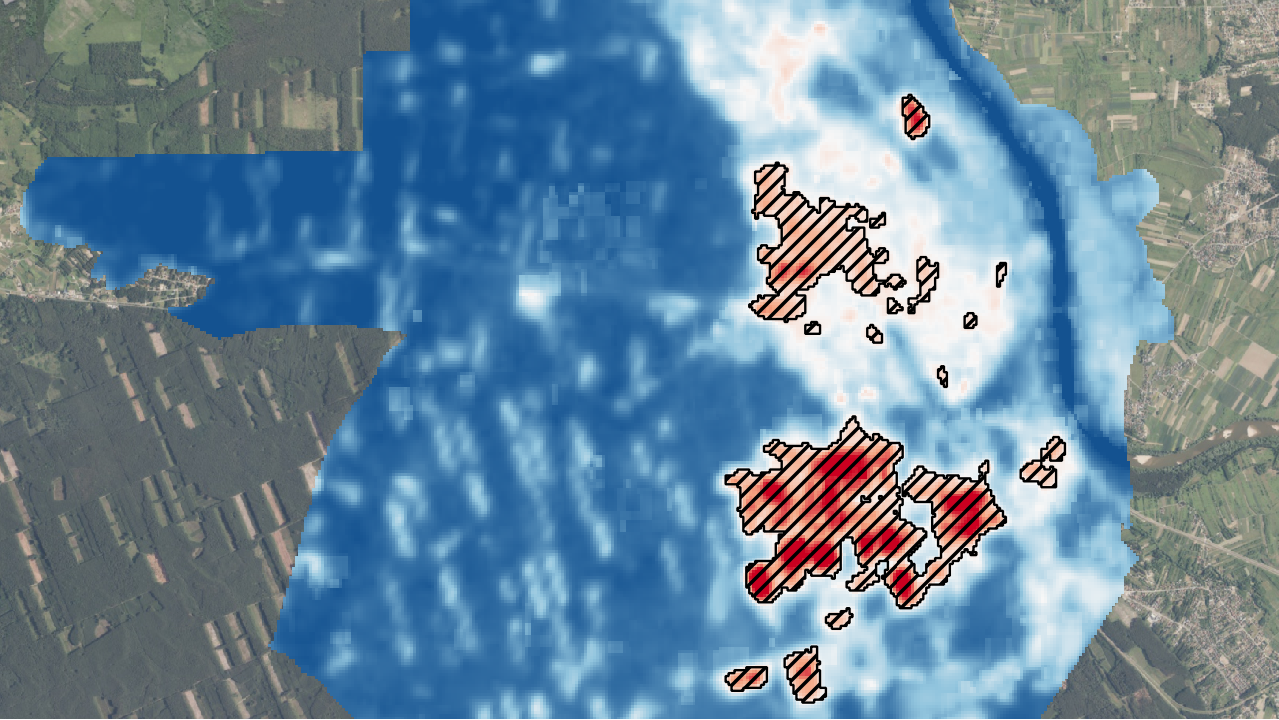

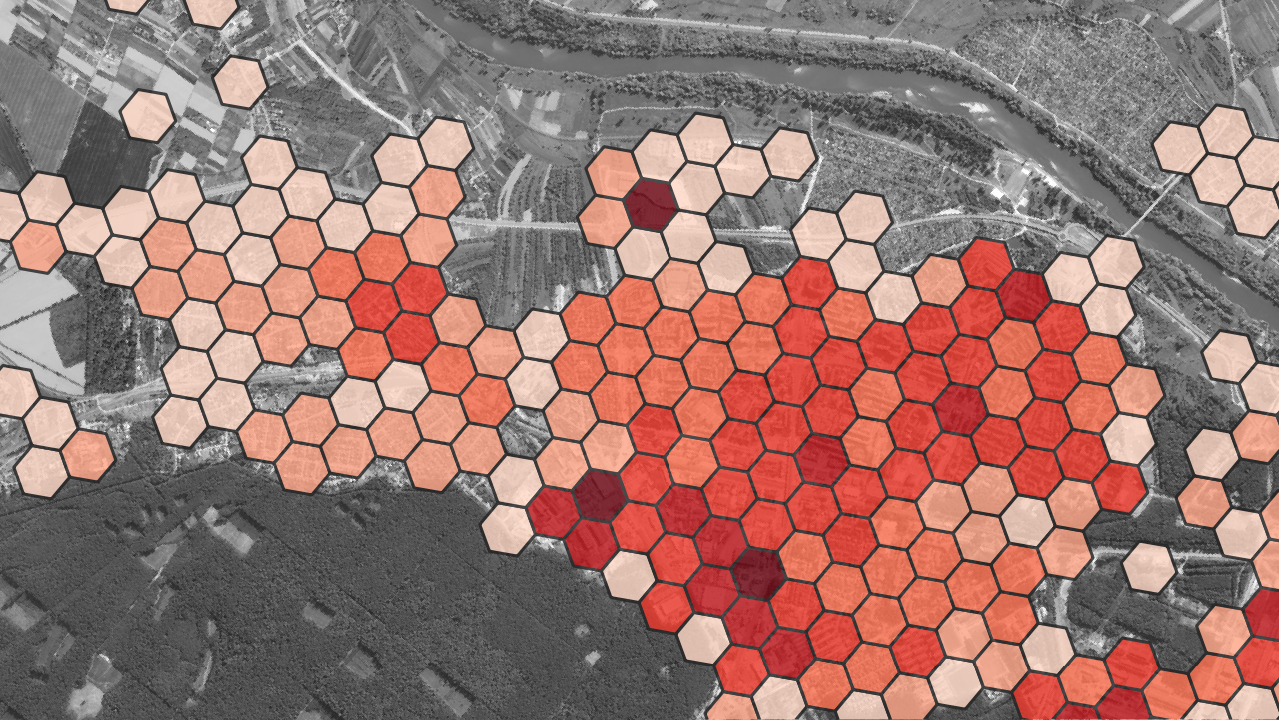
Based on the thermal satellite images, we prepare maps of the distribution of surface temperatures and the intensity of the surface urban heat island (SUHI). As a result of image analysis, we also determine the extent of the SUHI phenomenon.
The analysis precisely identifies the locations of the urban heat island and the most affected areas. It allows planning actions to negate the negative impact of the SUHI on the neighbourhood. The analysis can also be used in the application for funding programs to reduce SUHI, among other things.
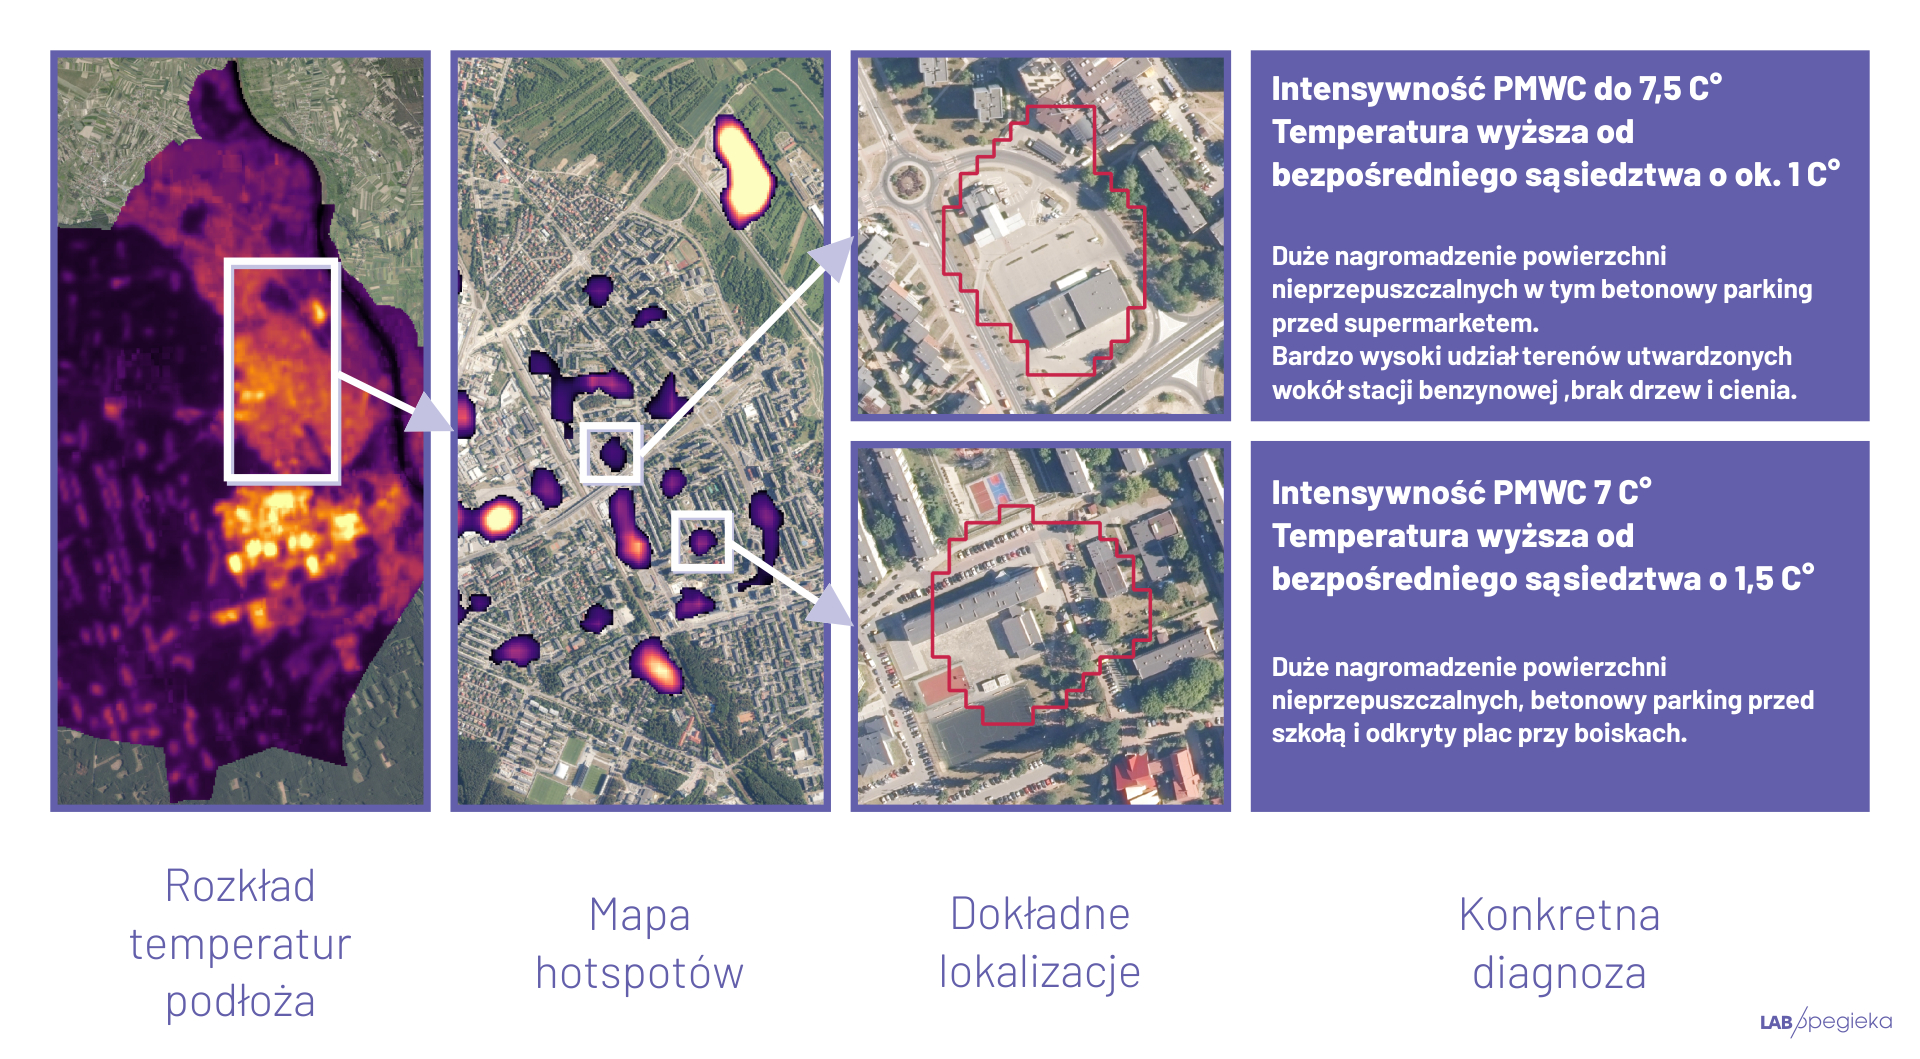
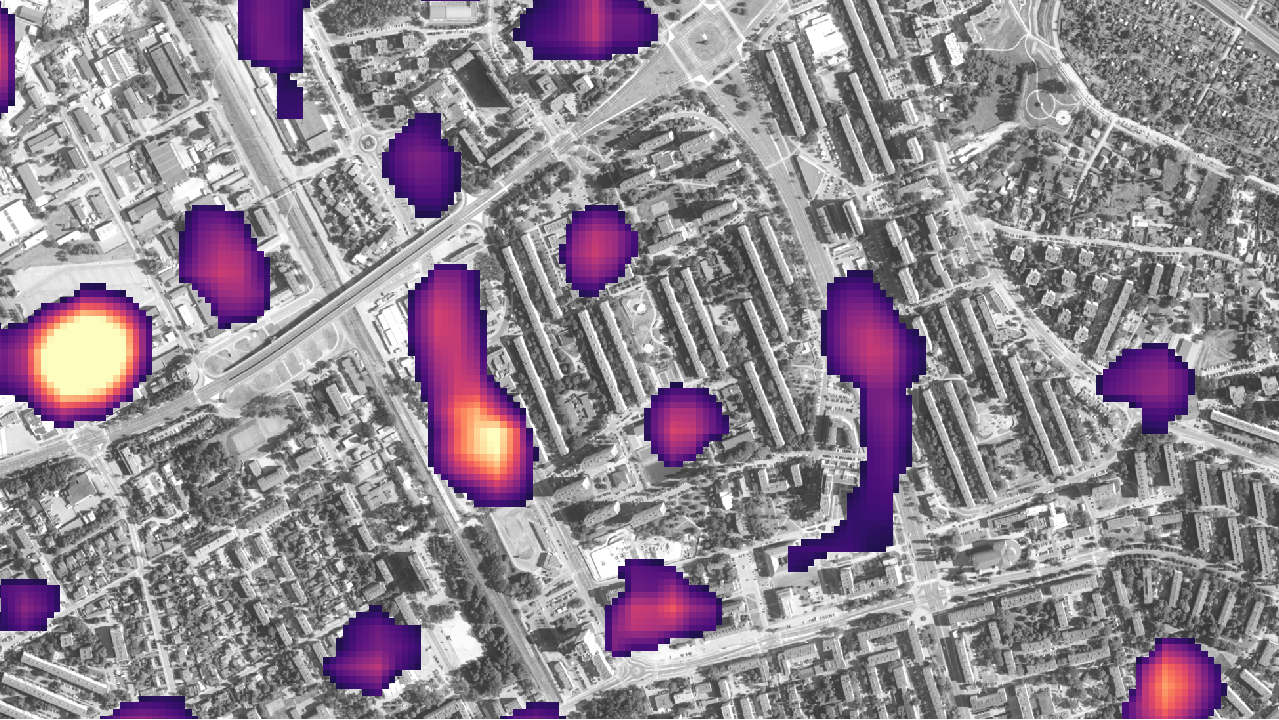
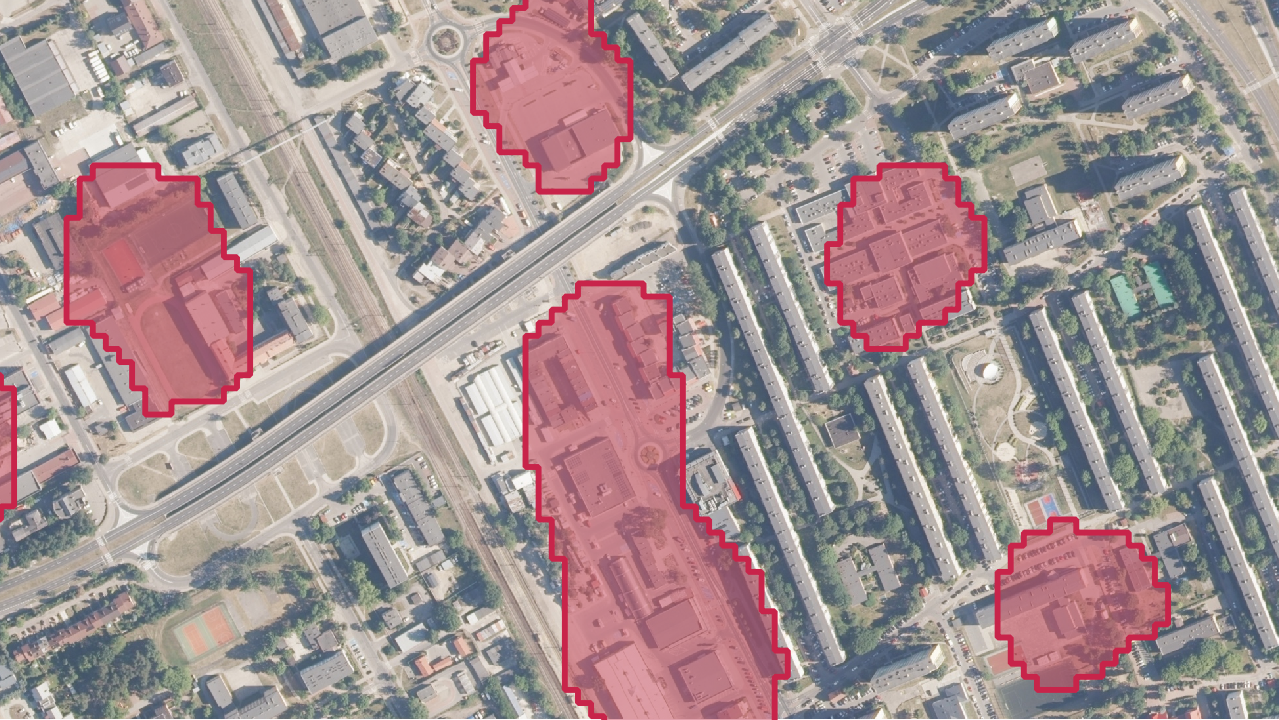

Analysis of local heat islands, resulting in a vector layer indicating specific locations characterized by higher surface temperatures than the immediate surroundings.
Result is a report with verification and evaluation of specific indications.
The study makes it possible to analyze individual cases and, depending on land use, recommend specific actions such as local development of green or blue infrastructure, concrete removal and introduction of shading.
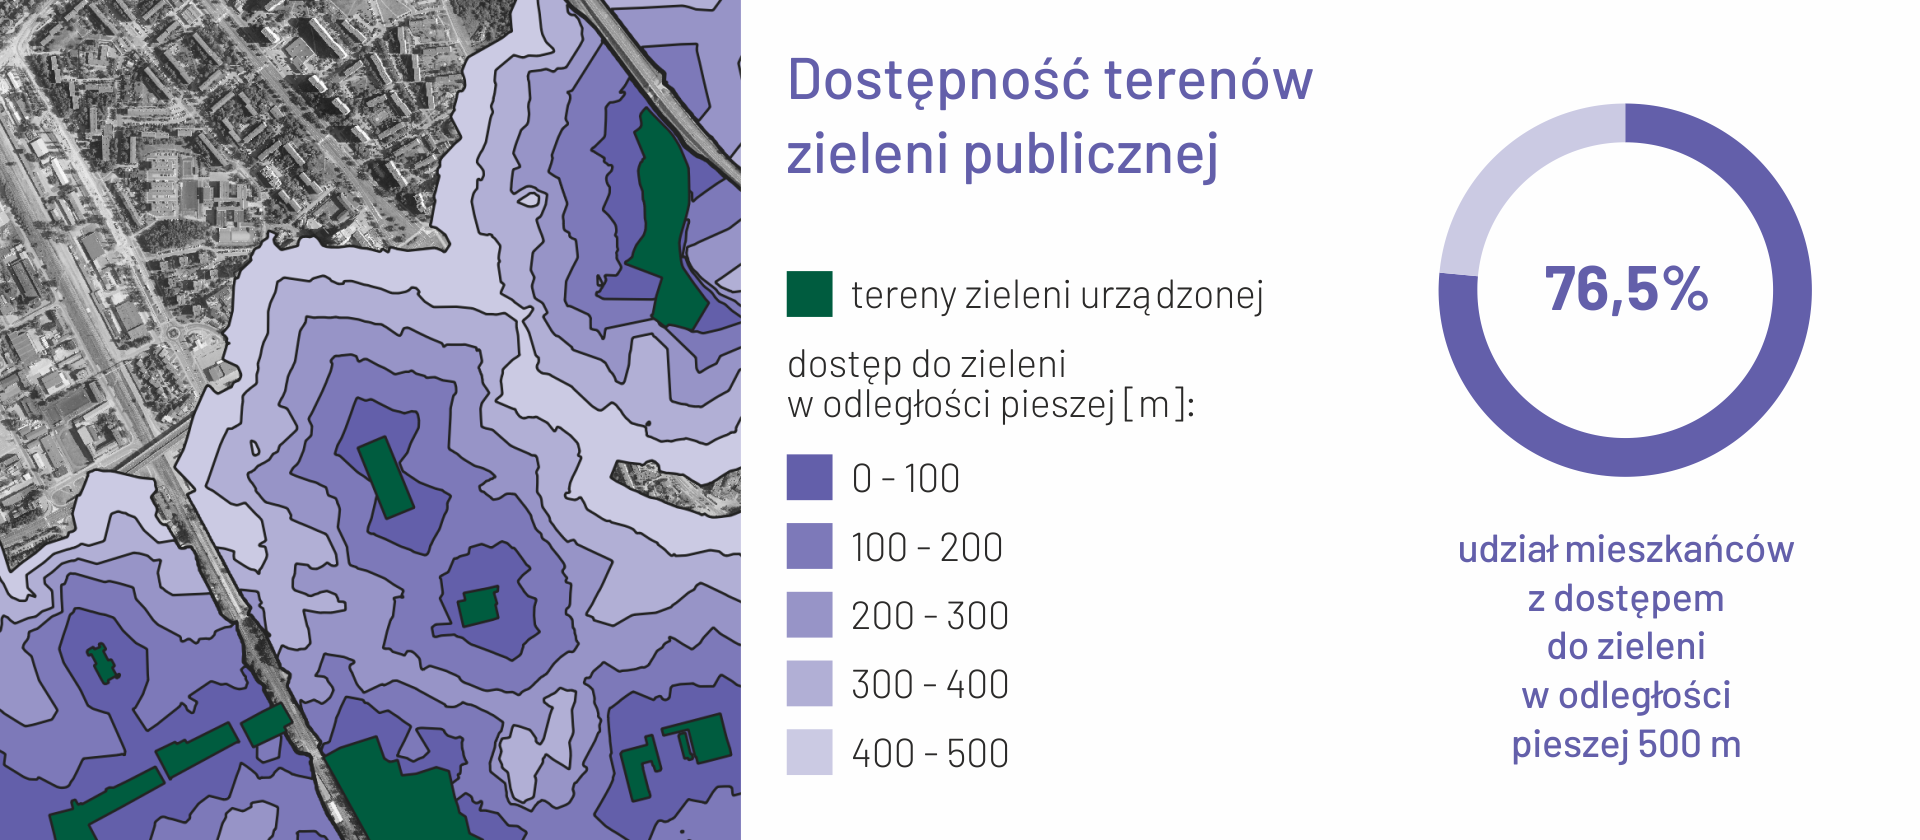
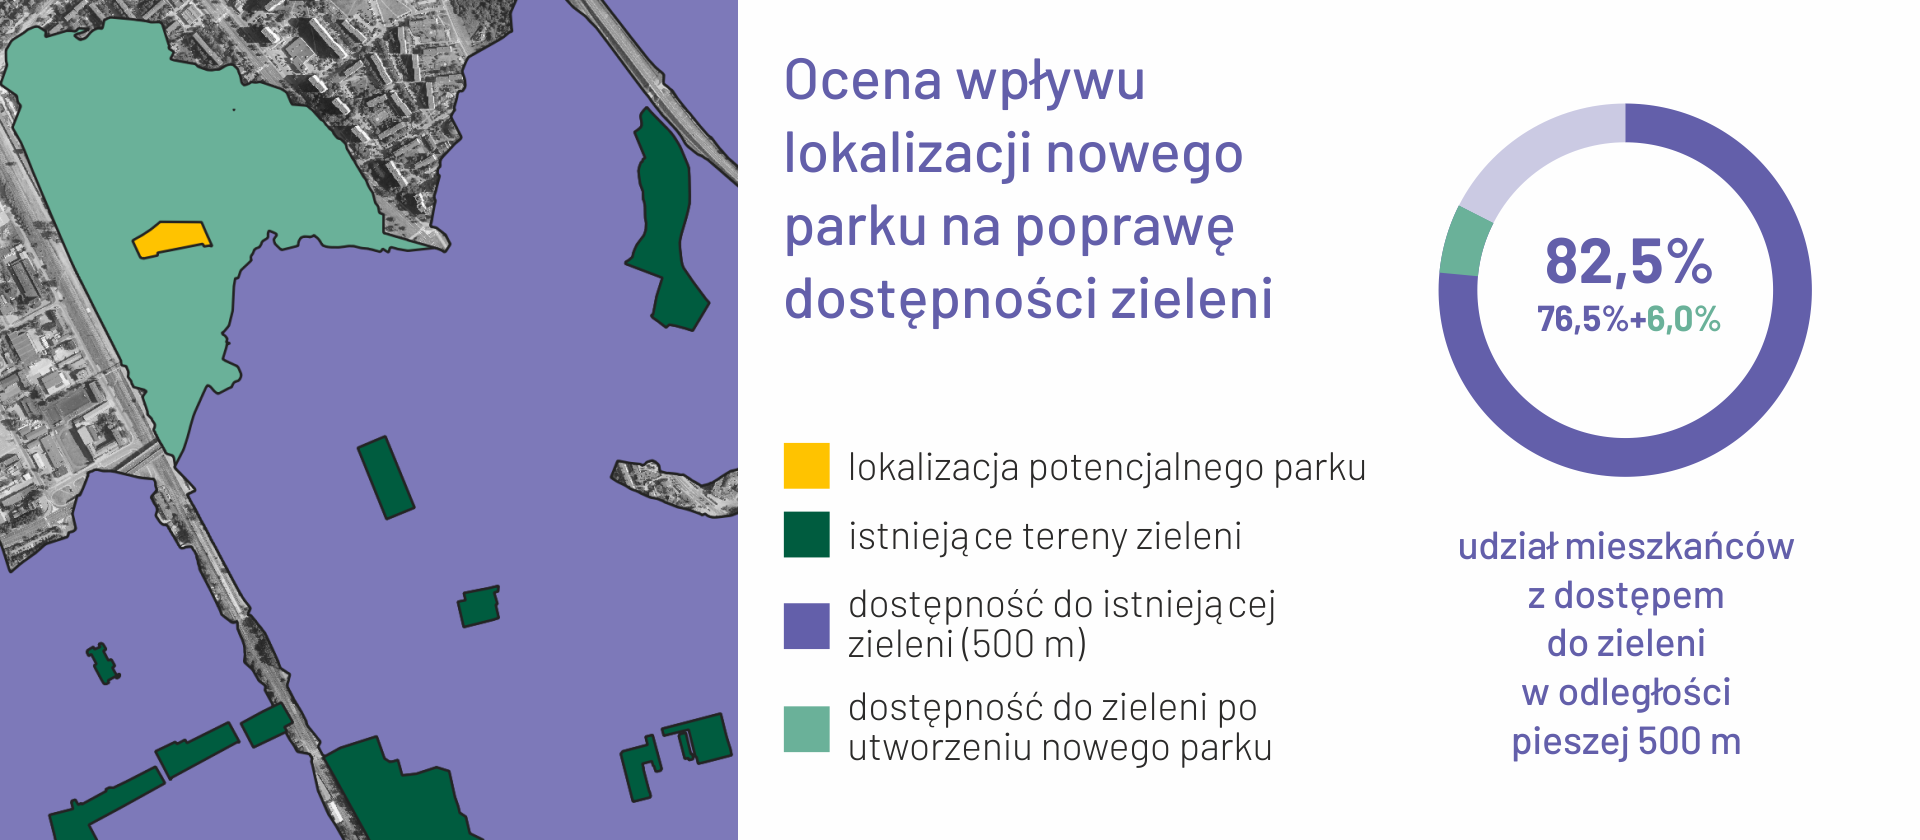
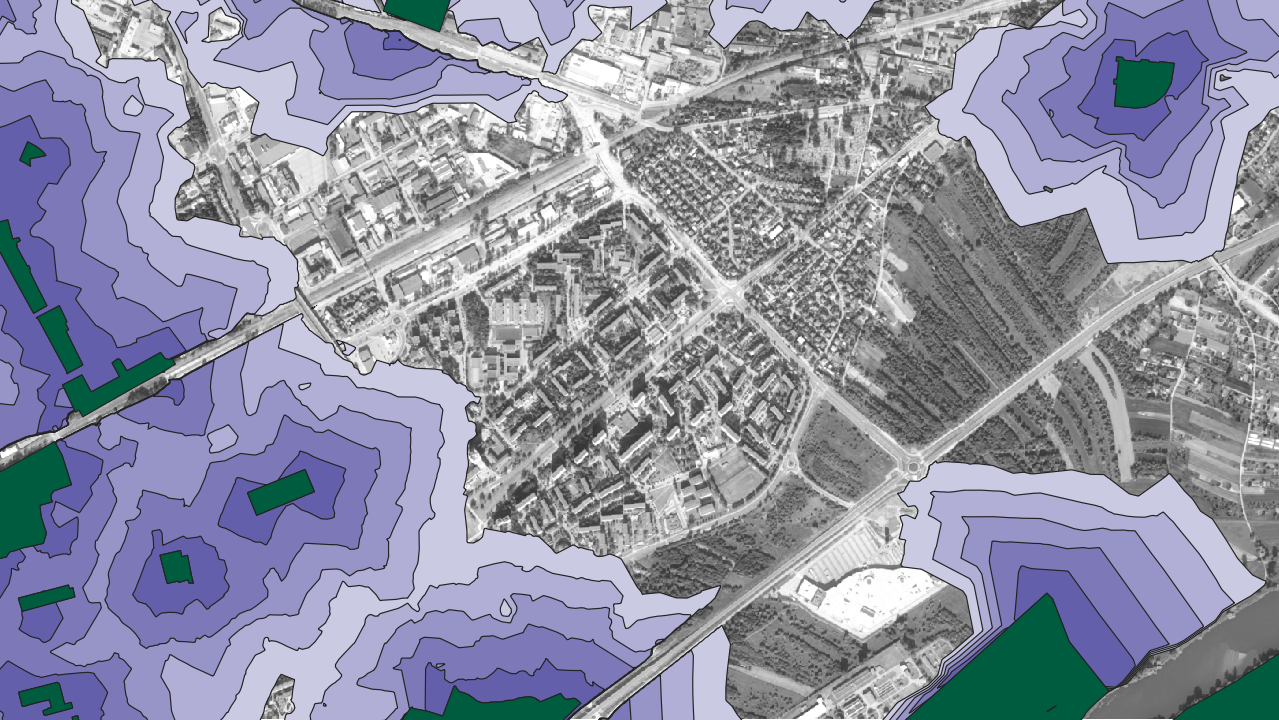

A network analysis that determines accessibility of green areas in walking distance (calculated along sidewalks and paths). The final result takes into account barriers such as expressways and rivers.
The map allows for assessing what percentage of residents have access to green spaces at a given distance, as well as identifying problem areas that require greening actions.
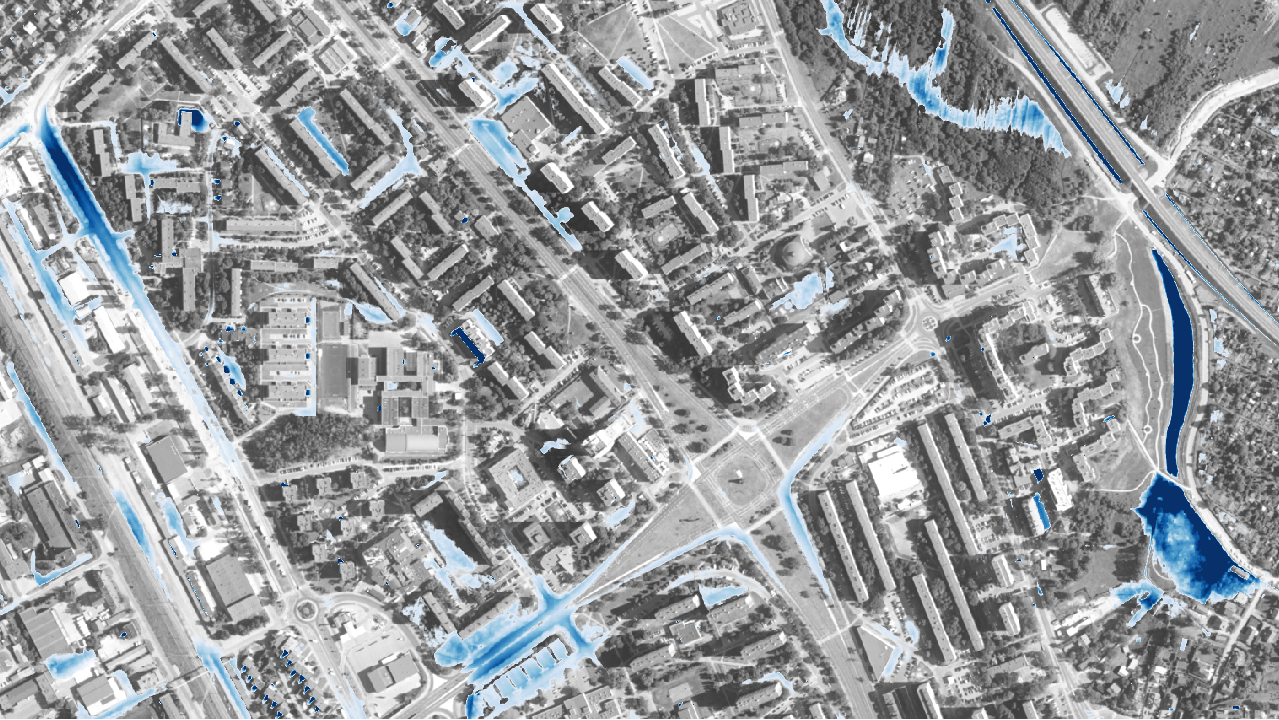

We perform simulations of rapid rain bursts. As a result of surface runoff analysis, we identify places where water naturally collects and in what volume. We map drainless basins and areas with a high risk of flooding. In addition to maps, we include recommendations for the location of rain gardens or retention basins in the report.
The resulting map allows us to understand where is the highest risk of local flooding and recommend measures such as identifying areas to de-concrete to increase infiltration of rainwater into the ground, or locating retention basins and rain gardens.
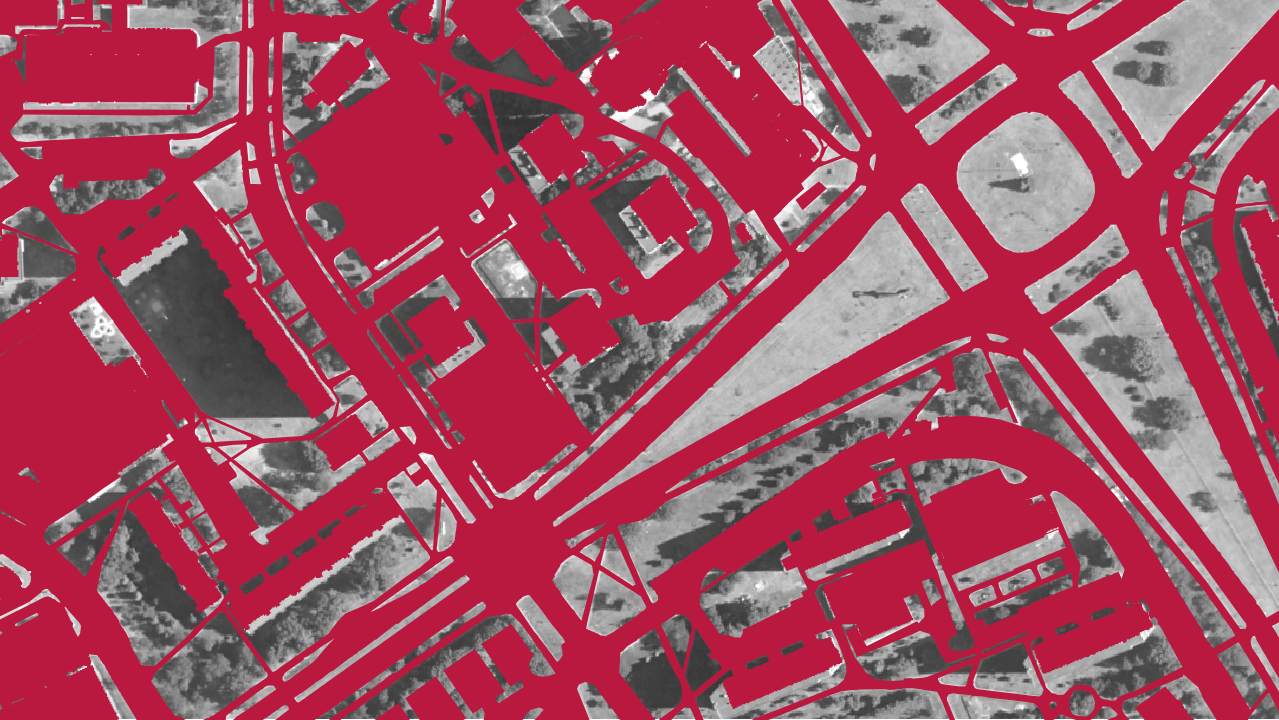

On the basis of advanced high-resolution orthophoto classification, we provide a highly detailed map of the impermeable surfaces. Detection accuracy of 80-90%, with the possibility of manual improvement.
The report includes an analysis of the distribution of impermeable surfaces in the city, along with a description..
An accurate inventory of impervious surfaces allows us to assess the degree of sealing of a given area and recommend measures to de-concrete part of the land in order to level the urban heat island effect or increase infiltration into the ground.
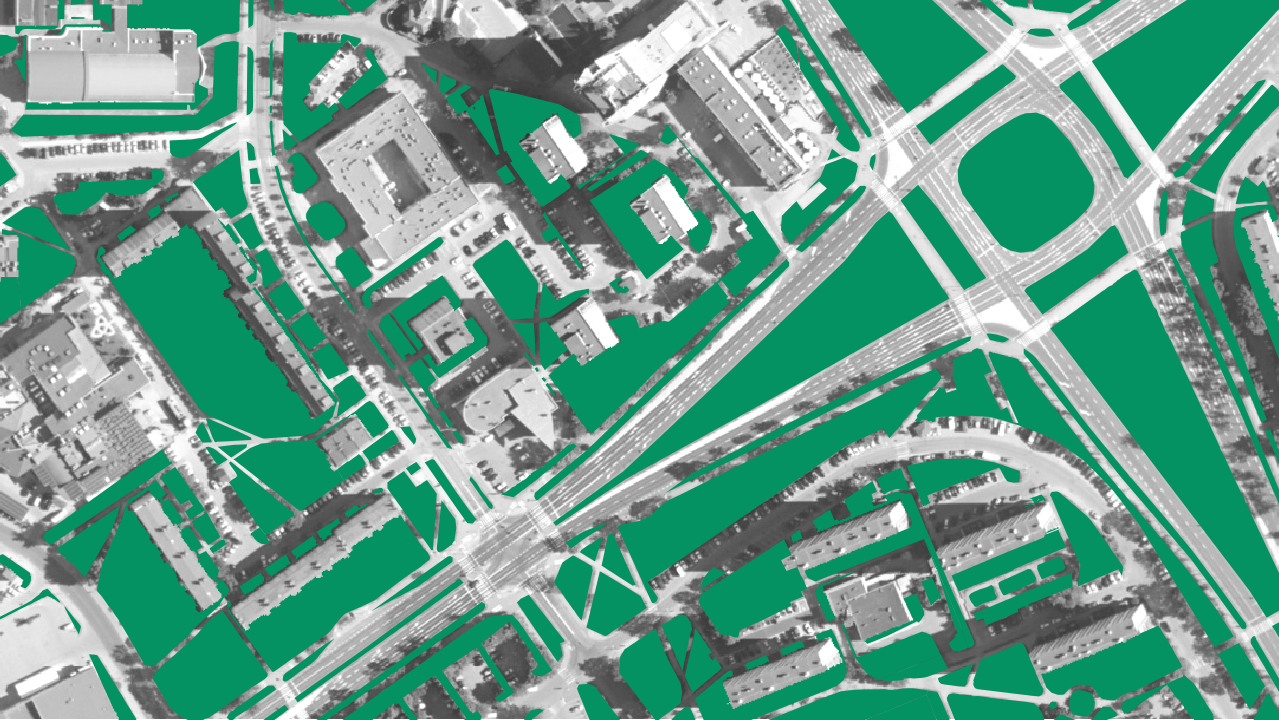

The map of biologically active surfaces corresponds to the level of detail of the map of impervious surfaces. Based on the map, we also analyze the percentage of BAA for selected areas.
The map allows for calculating the BAA index for parcels or larger spatial units and verifying the provisions of local zoning plans. It is also a basis for recommending areas for increasing building density, which will help limit urban sprawl.
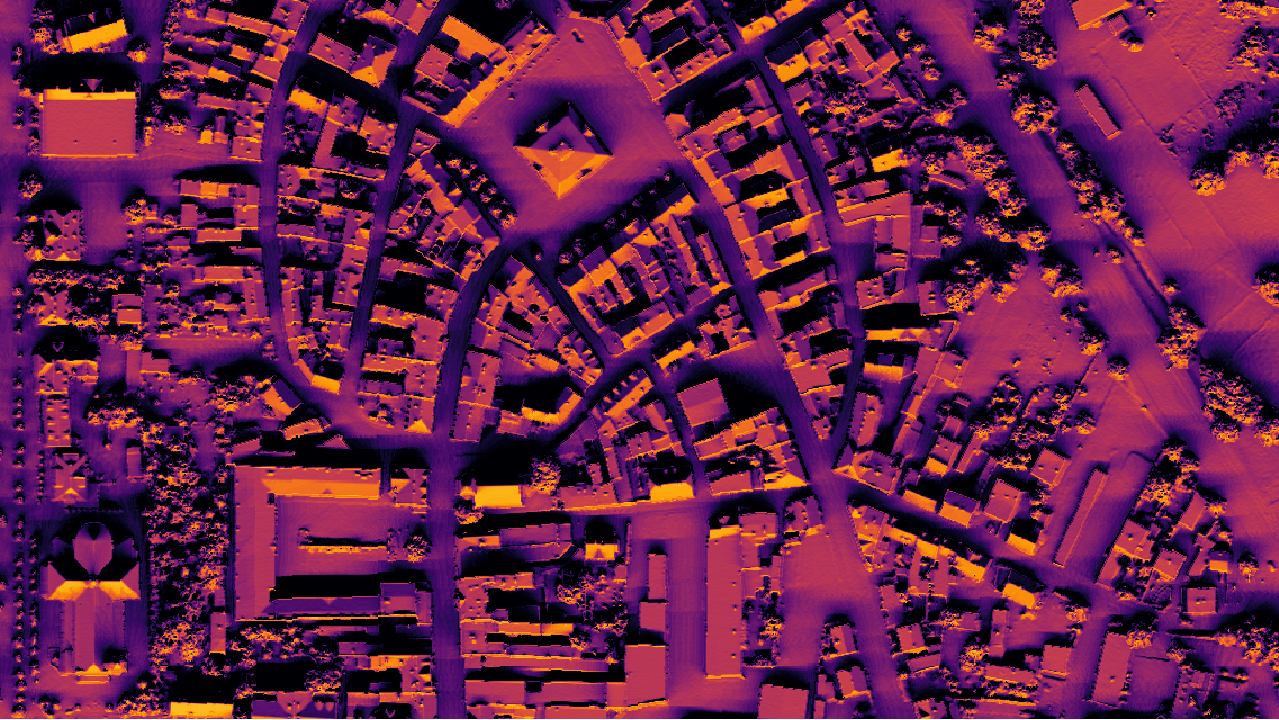
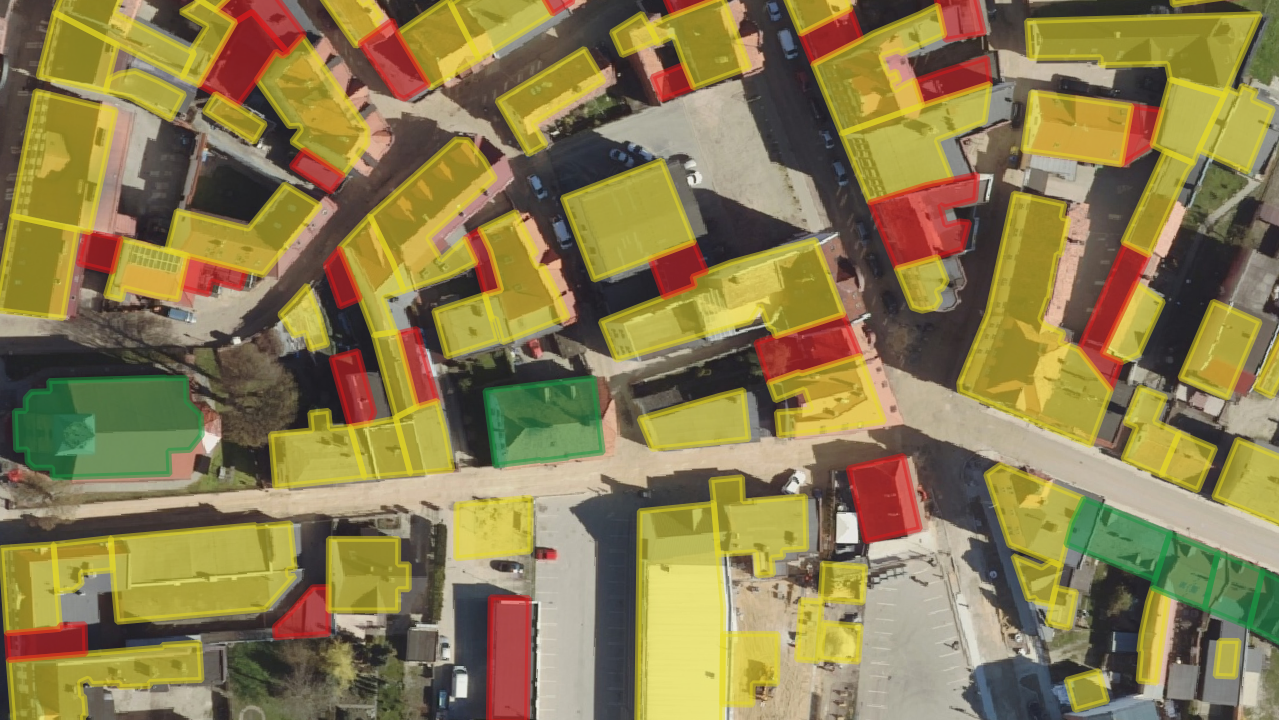

Based on lidar data, we are creating monthly solar radiation intensity maps and solar potential maps.
The maps can be used as an aid to, among other things, selecting appropriate plant species for the light conditions present and determining the solar potential of roofs.
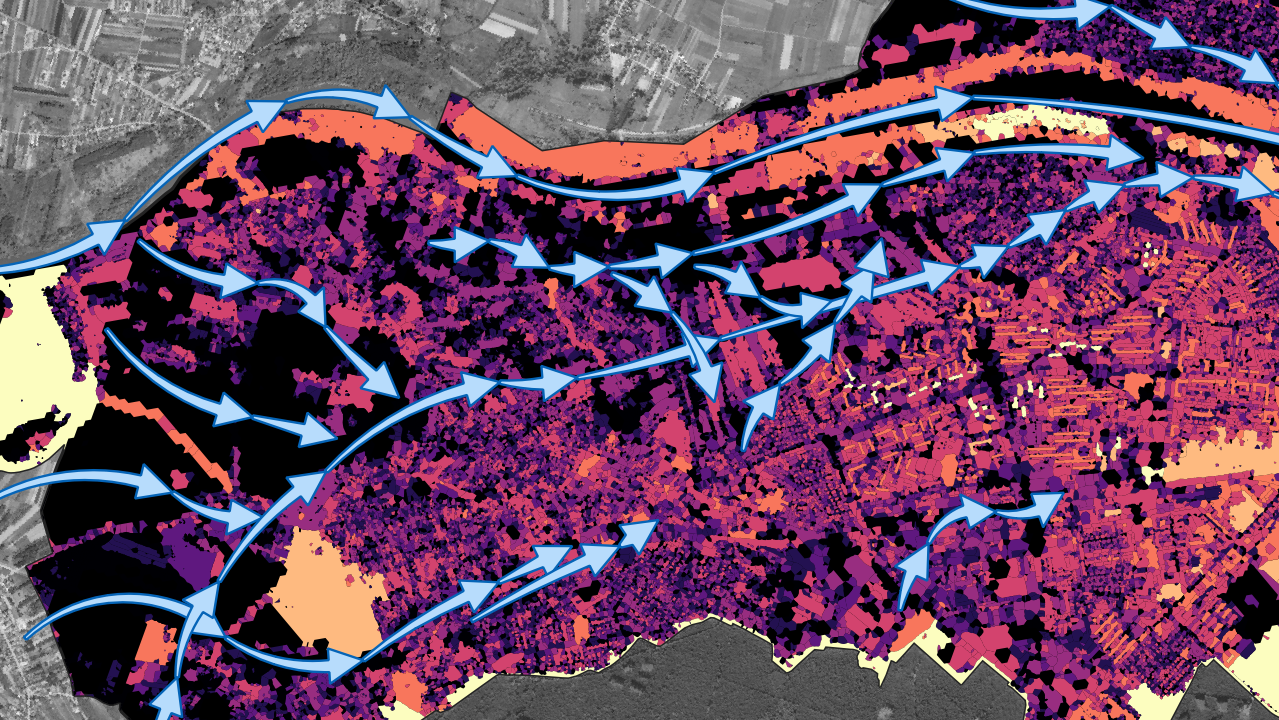

Analysis based on roughness parameter extraction with the use of building outlines and high vegetation from lidar data.
In case areas meeting the criteria for air ventilation corridors are detected, the map can serve as a basis for deciding on the protection of the corridor and excluding the area from construction.
|
Aleja Tysiąclecia 11 82-300 Elbląg |
|
phone: +48 (55) 237 60 00 fax: +48 (55) 237 60 01 |
|
E-mail address: |
|
ul. Grzybowska 80/82 lok. 700 00-844 Warszawa |